Roadway engineering in Las Vegas must contend with the Mojave Desert’s variable subsurface—from cemented caliche hardpans to wind-deposited sands—making geotechnical investigation critical before any pavement design. Our roadway category addresses site-specific challenges under Clark County and Nevada DOT standards, including expansive soils and collapse-prone deposits. A thorough CBR study for road design establishes the subgrade strength needed to meet AASHTO pavement structural requirements in this arid basin.
These investigations serve arterial expansions, residential subdivisions, and industrial park access roads where poor soils or deep fill sections demand engineered solutions. Beyond laboratory CBR values, we integrate field density testing and moisture-conditioned modulus evaluation to refine pavement thickness and avoid costly over-excavation. The resulting recommendations align directly with NDOT materials specifications and local agency review thresholds, keeping your roadway project on schedule from subgrade proof-roll through final lift acceptance.
In Las Vegas arid soils the plasticity index can jump from 8 to 35 within one borehole. That lateral variability demands a dense sampling grid.
Service characteristics in Las Vegas
Critical ground factors in Las Vegas
Las Vegas sits on the Las Vegas Valley fault zone. The basin fill consists of clay, silt, sand, and gravel with variable plasticity. A high-plasticity clay (CH) can swell up to 10 % by volume when wetted. In a city that receives only 4 inches of rain per year but experiences flash floods, the cyclical wet-dry cycles cause slab heave and differential movement. Missing the Atterberg limits means you won't know if the soil is expansive. That omission can lead to cracked walls, tilted floors, and post-tension slab failures. We have seen houses in Summerlin and Green Valley with PI values above 35. The remedy — deep foundations or soil replacement — costs exponentially more than the lab test.
Our services
We bundle Atterberg limits with complementary tests to give you a full soil profile for any Las Vegas project.
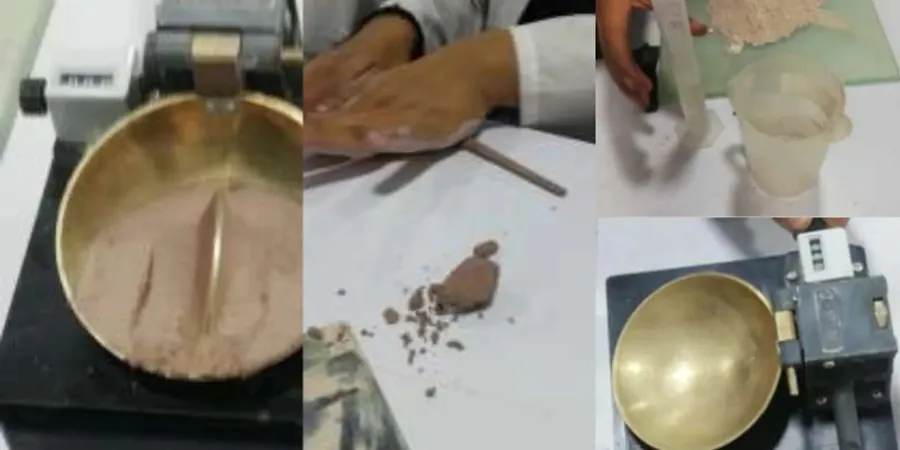
Liquid Limit (Casagrande Cup)
Multi-point determination with 6 data points. We report the flow curve and the LL value at 25 blows. Precision ±1 %.
Plastic Limit (3.2 mm Thread)
Rolling method per ASTM D4318. We record the moisture content at thread crumbling. Repeatability check on duplicate samples.
Plasticity Index & USCS Classification
PI = LL - PL. Combined with grain-size data we assign the group symbol (CL, CH, ML, MH). Critical for expansive soil identification.
Linear Shrinkage Test
Oven-dried bar method. Measures volumetric change potential. Useful when PI > 20 or for pavement subgrade evaluation.
Frequently asked questions
What is the difference between liquid limit and plastic limit in Atterberg tests?
The liquid limit is the moisture content where soil starts to flow under its own weight (measured with the Casagrande cup). The plastic limit is the moisture content where a soil thread 3.2 mm in diameter crumbles when rolled. The difference between them is the plasticity index.
How much does Atterberg limits testing cost in Las Vegas?
The typical cost for a full Atterberg limits test (liquid limit, plastic limit, and PI) ranges between US$60 and US$110 per sample. This price includes the multi-point method and a written report. Volume discounts apply for 10+ samples from the same project.
Why are Atterberg limits important for construction in Las Vegas?
Las Vegas has expansive clay deposits from ancient lake beds. Without Atterberg limits you cannot identify CH or MH soils. These soils swell when wet and shrink when dry. That movement can crack slabs, tilt walls, and damage underground utilities. The test is required by IBC for any structure with shallow foundations on fine-grained soil.
How long does it take to get Atterberg limits results?
Standard turnaround is 48 hours from sample receipt. If the sample is wet we need to air-dry it first. For rush projects we can deliver results in 24 hours with a surcharge. We provide a digital PDF report with the flow curve graph and USCS classification.